From Zero to Financial Market Analytics in less than 60 seconds!

Forget about complex software installations, server deployments and tedious coding, with Stockdio you can integrate powerful financial charts and stock market analytics in your web and mobile applications in a matter of minutes.

“Creating a Stockdio Account is Absolutely Free and Easy to Set up”

Full control over every chart, every parameter, every indicator!

Data is included!

Stockdio includes market data from US and international exchanges including but not limited to Europe, Canada, India, China, Korea, Japan and Brazil with no additional subscriptions or data agreements required!
View all Exchange Markets included.

Easy to use and integrate!

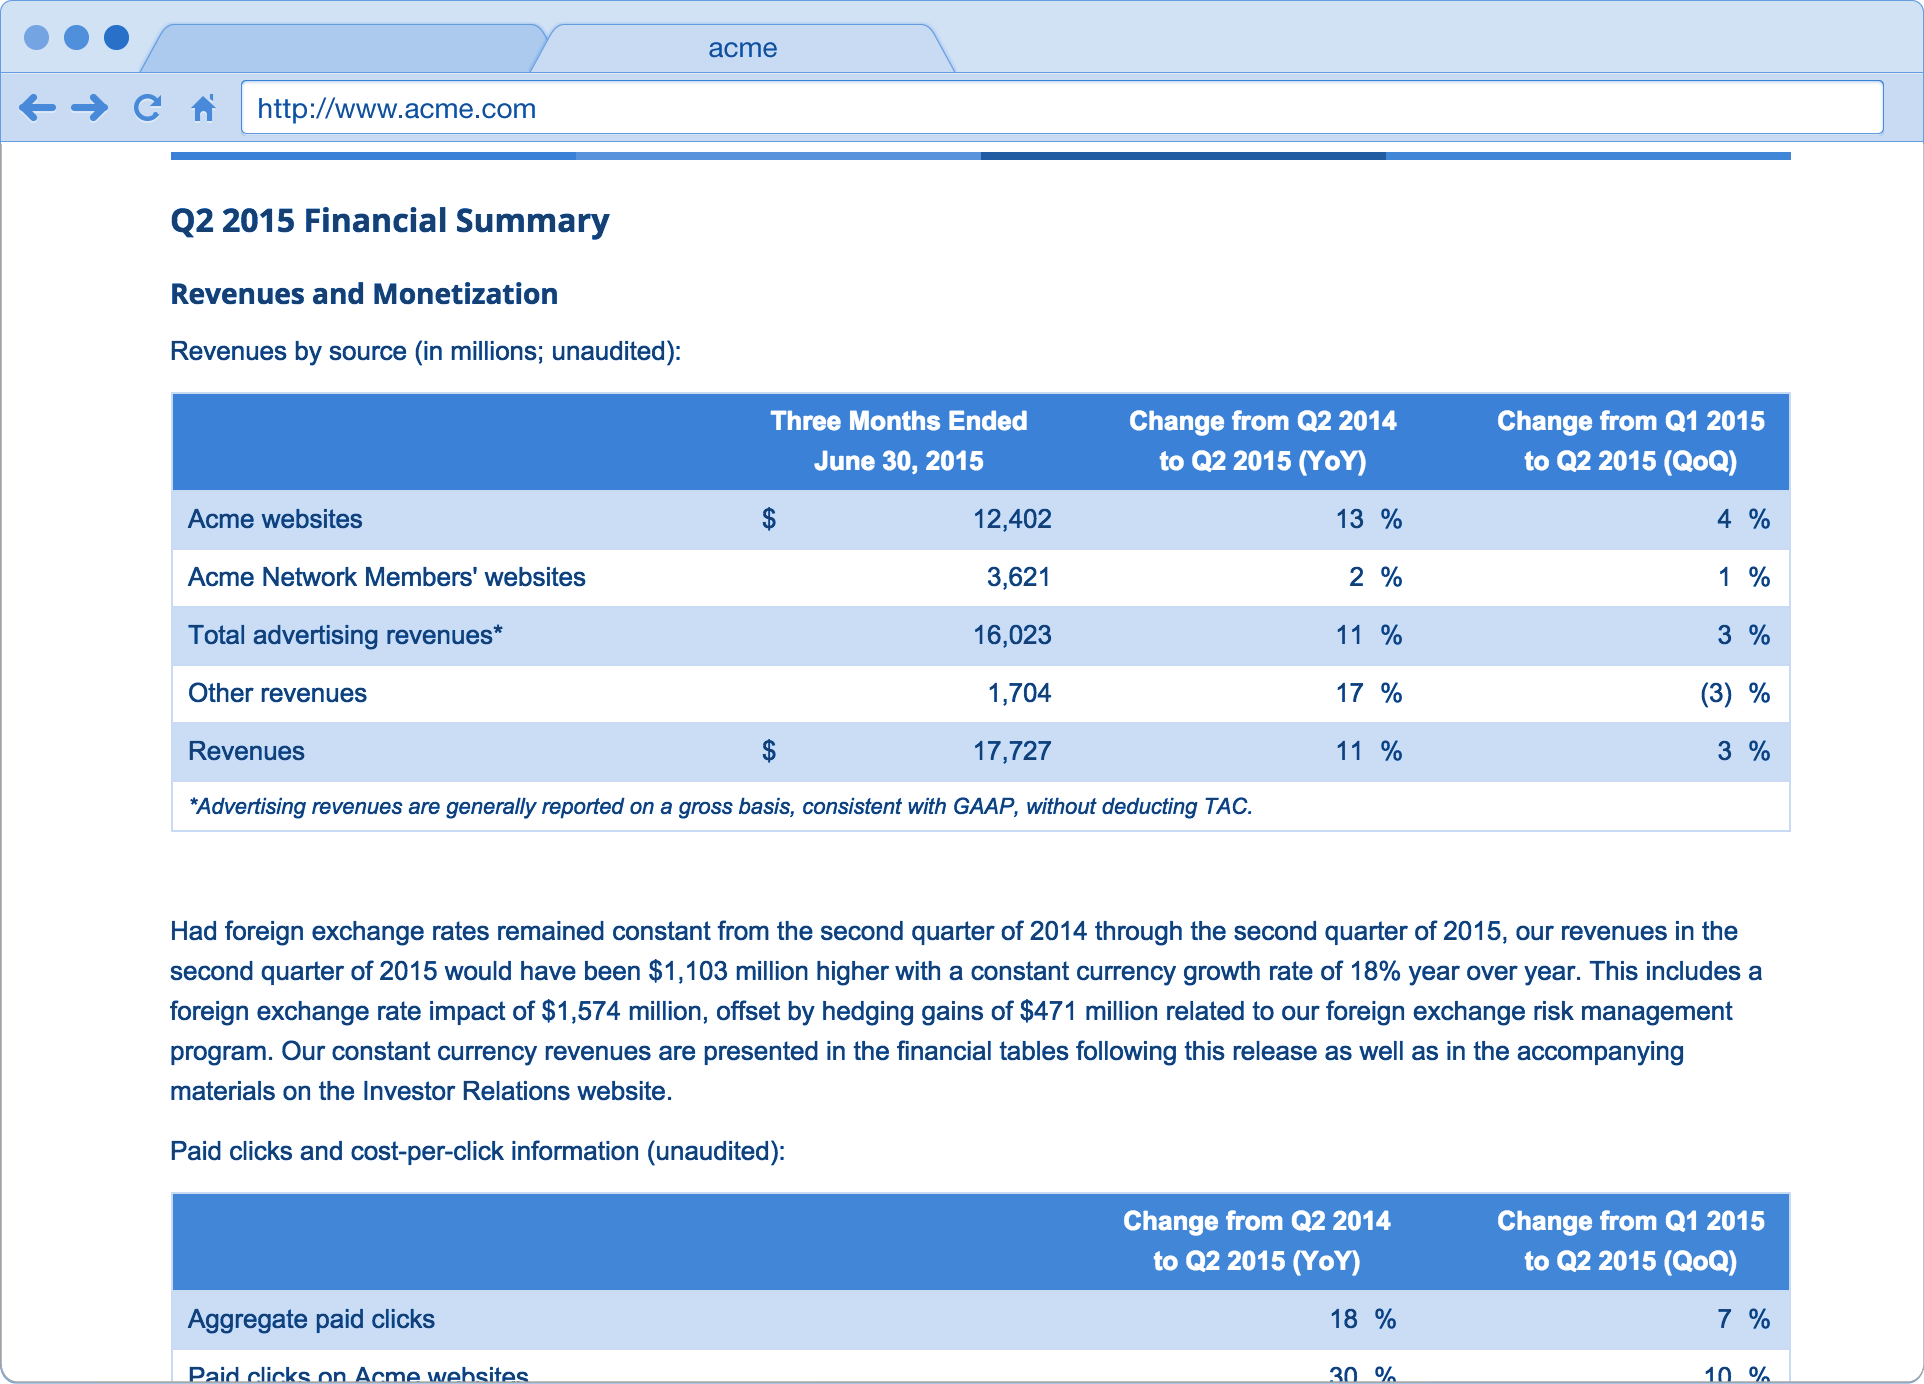
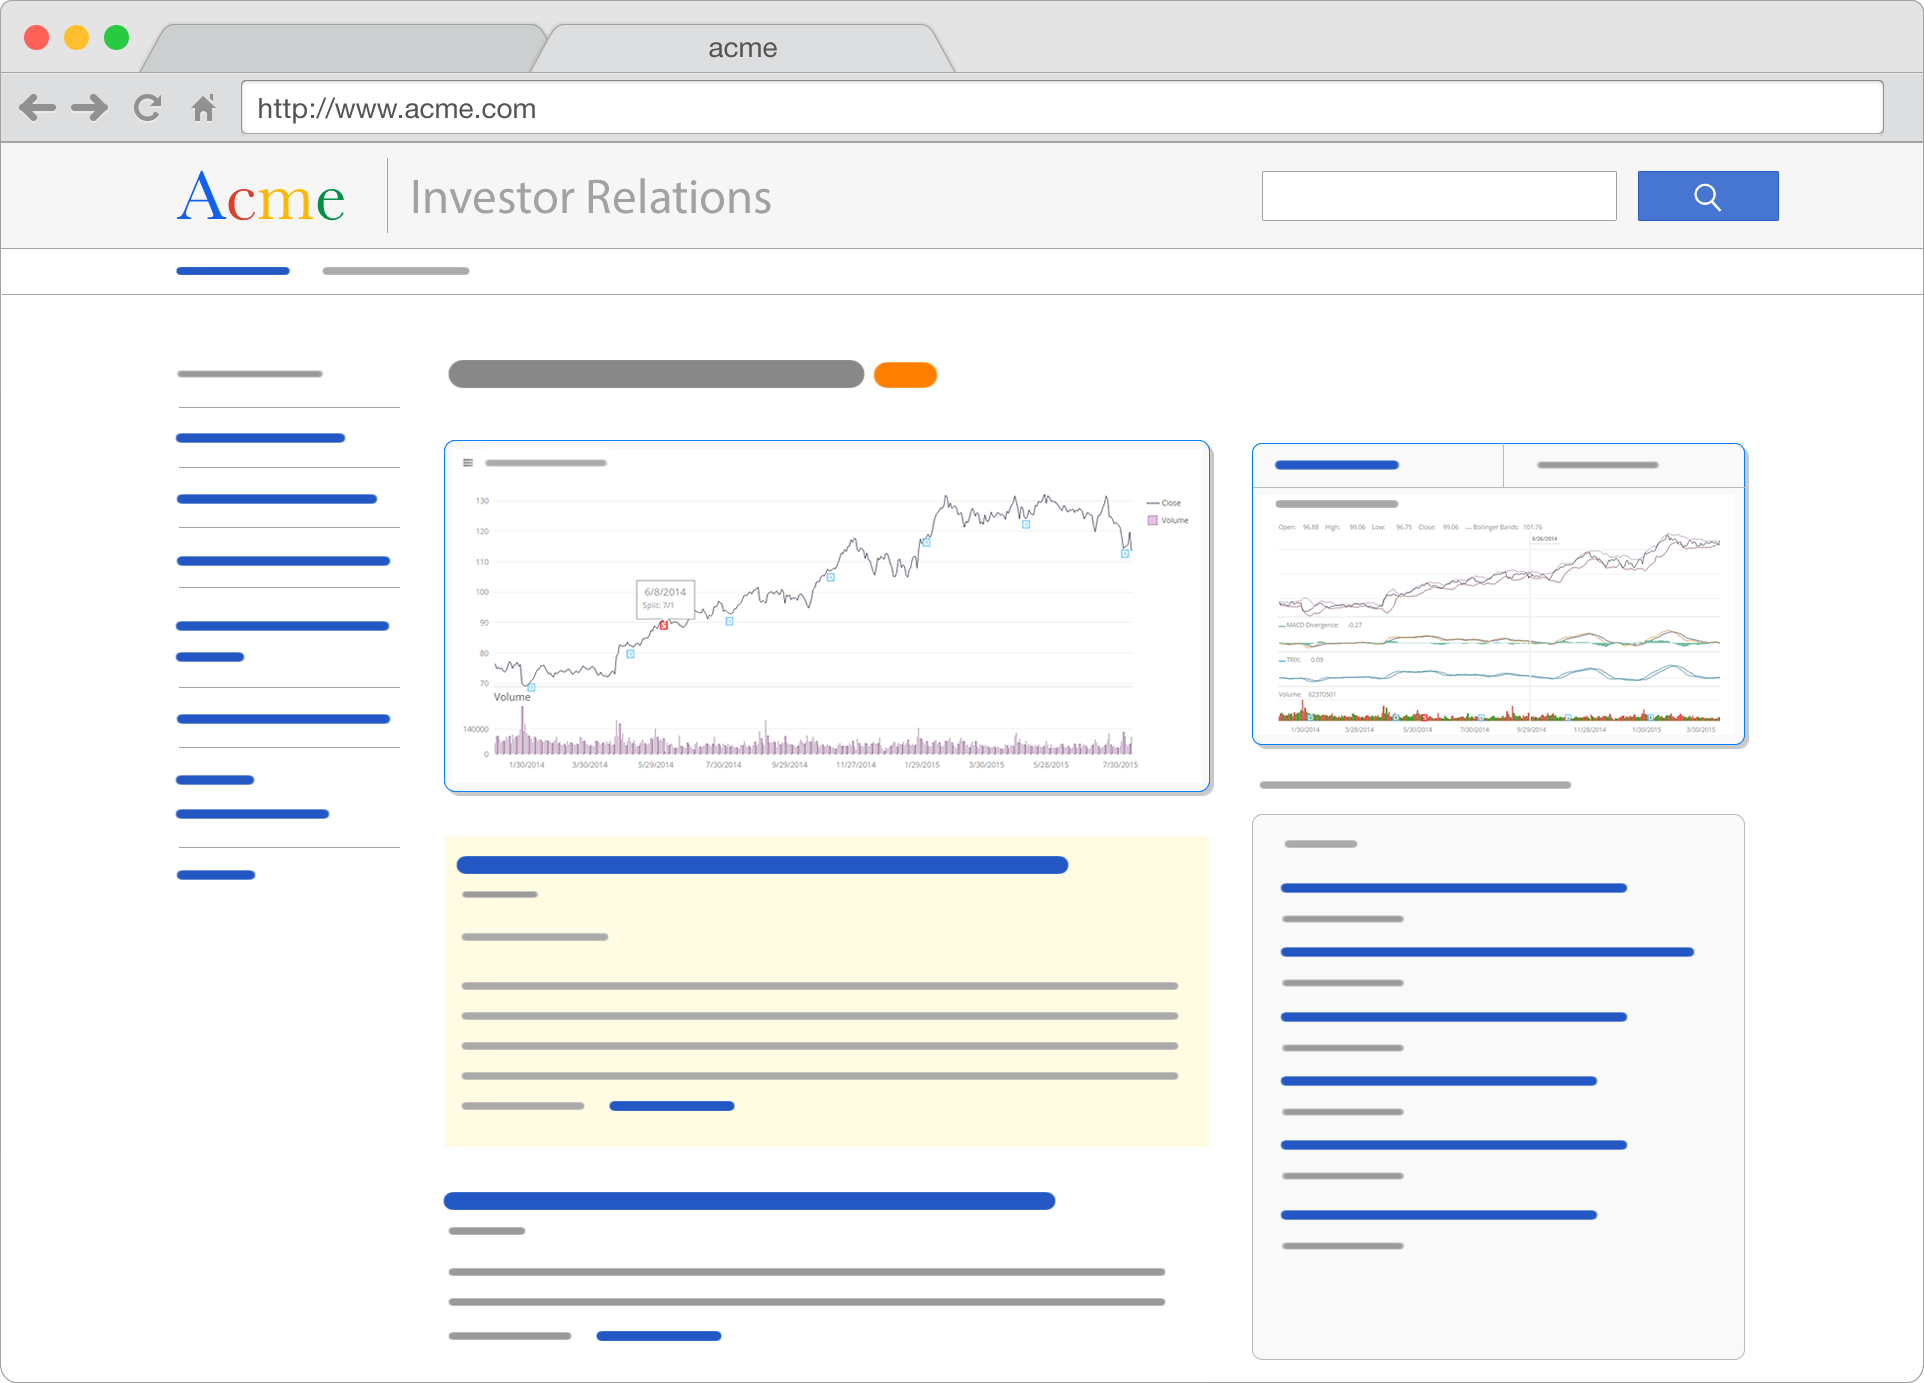
Stockdio provides a comprehensive UI that lets you customize several different financial charts, including Historical Prices, Comparison, Price Change, Chart Groups, Point & Figure, Three line Break, Renko and Kagi Charts. Simply add the stock symbol you want to chart, adjust a few settings in the UI and voila! You are ready to deploy the most advanced financial charts within minutes!
Learn more

Fundamental and complex technical analysis requirements met

Regardless of the financial solution you are implementing, Stockdio provides dozens of fundamental and advanced technical analysis indicators you can add to your Baseline Charts, including dividends, splits, MACD, Envelopes, Bollinger bands among many others

Fully customizable aesthetics!

Stockdio provides a rich set of motifs and palettes you can apply with a single click to perfectly match charts with your corporate brand. You can even display US-based stocks company logos as watermarks on your charts! Did we mention you can also animate your charts? So what are you waiting for?
Learn more

Interactive and responsive

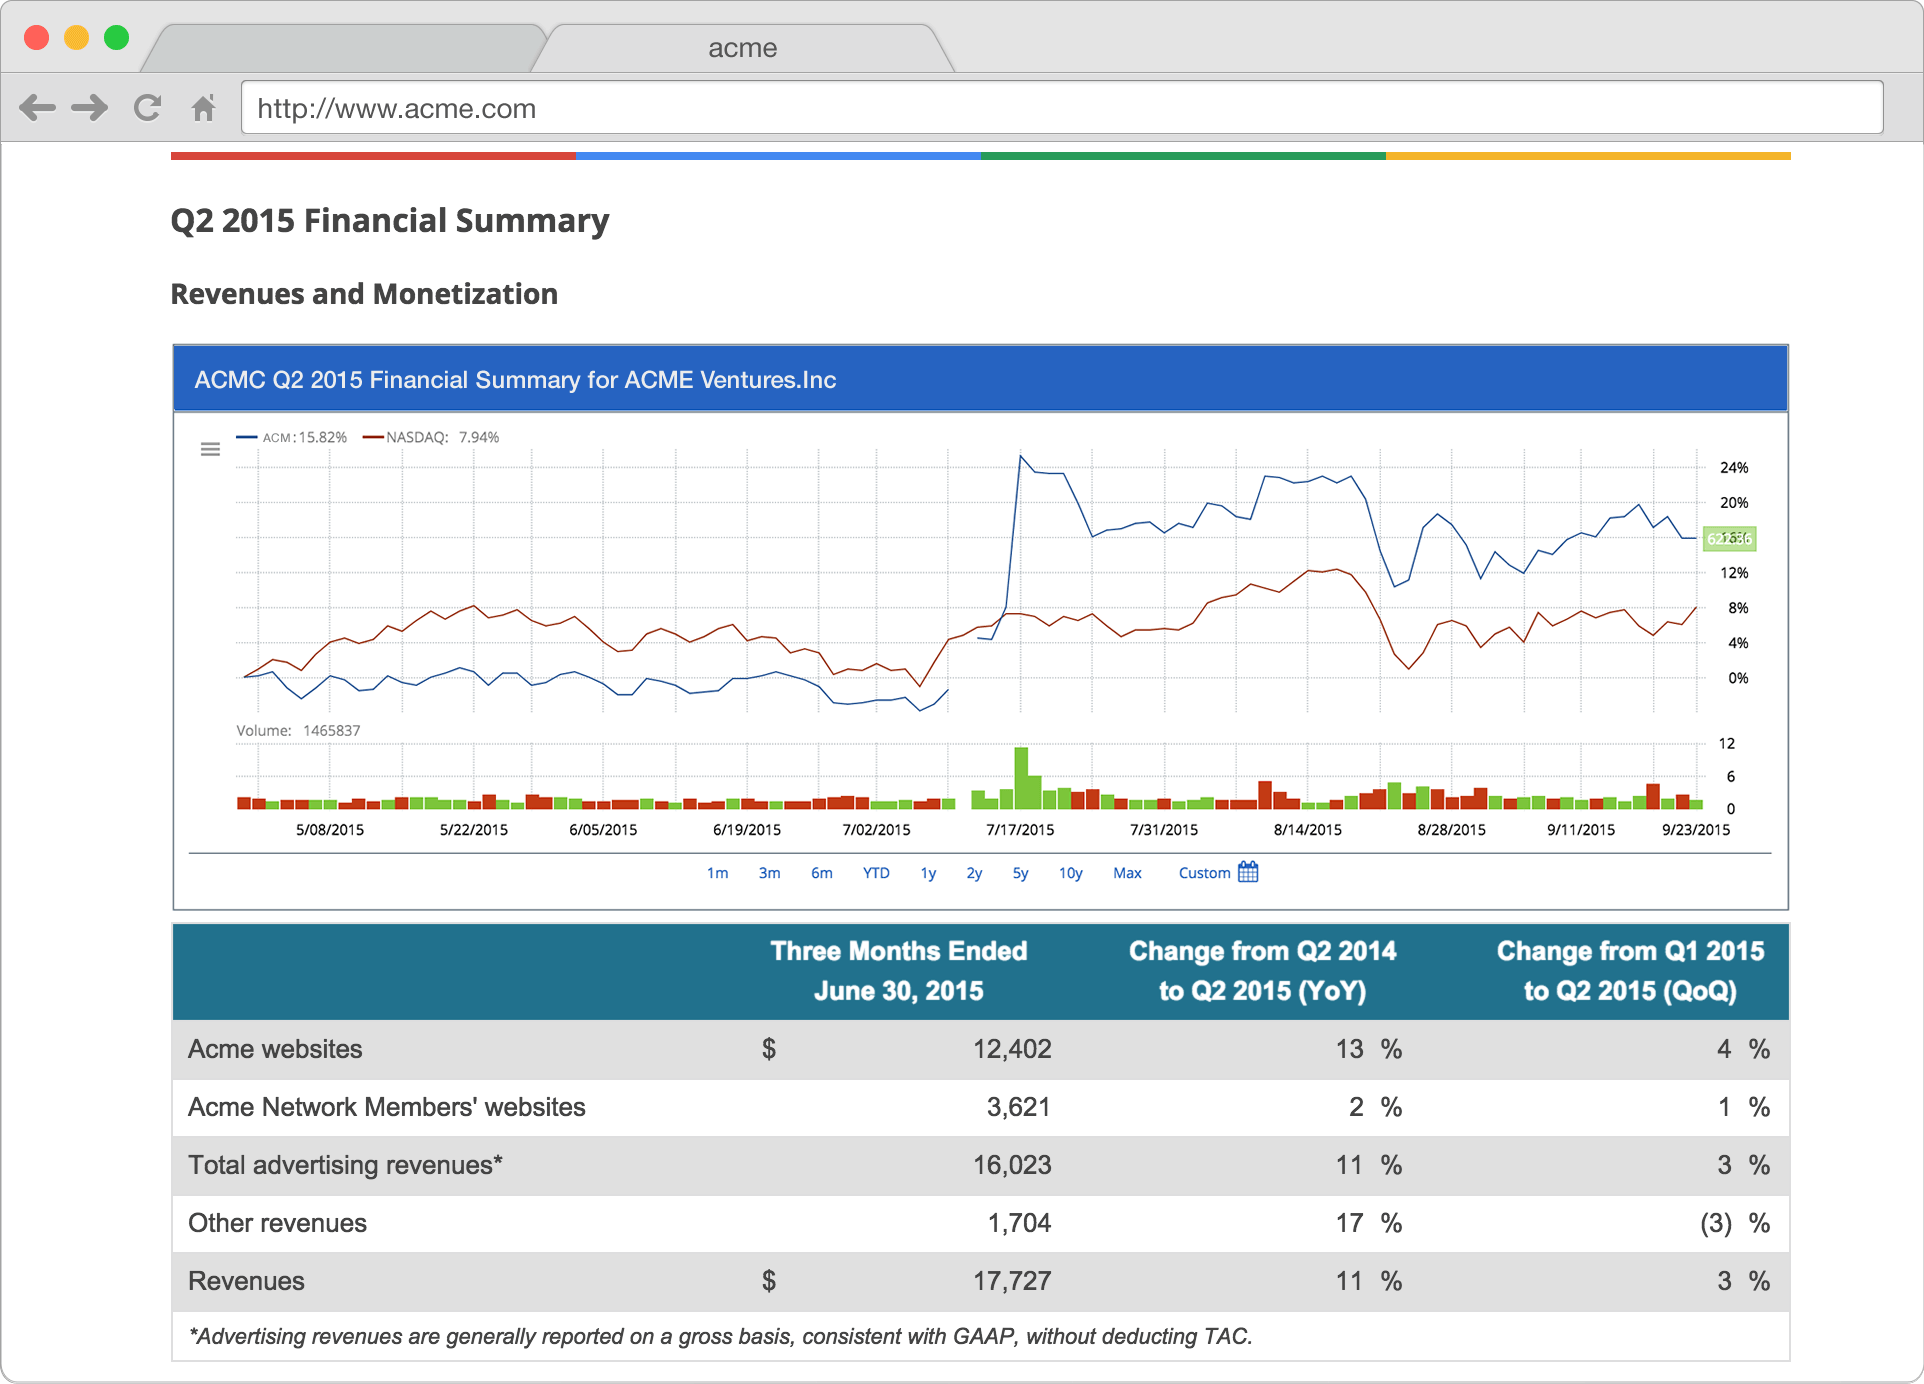
Simply put, Stockdio provides a powerful user experience! Static financial charts are a thing of the past. Our charts provide a fully interactive interface to help you and your users add technical Indicators, zooming, price overlays and much more!
Try a live sample

Scalable performance and pricing

With Stockdio you can develop any number of applications for free and then let Stockdio grow with you through a scalable pricing model that lets you serve thousands or millions of users effectively and affordably.

Copy and paste deployment!

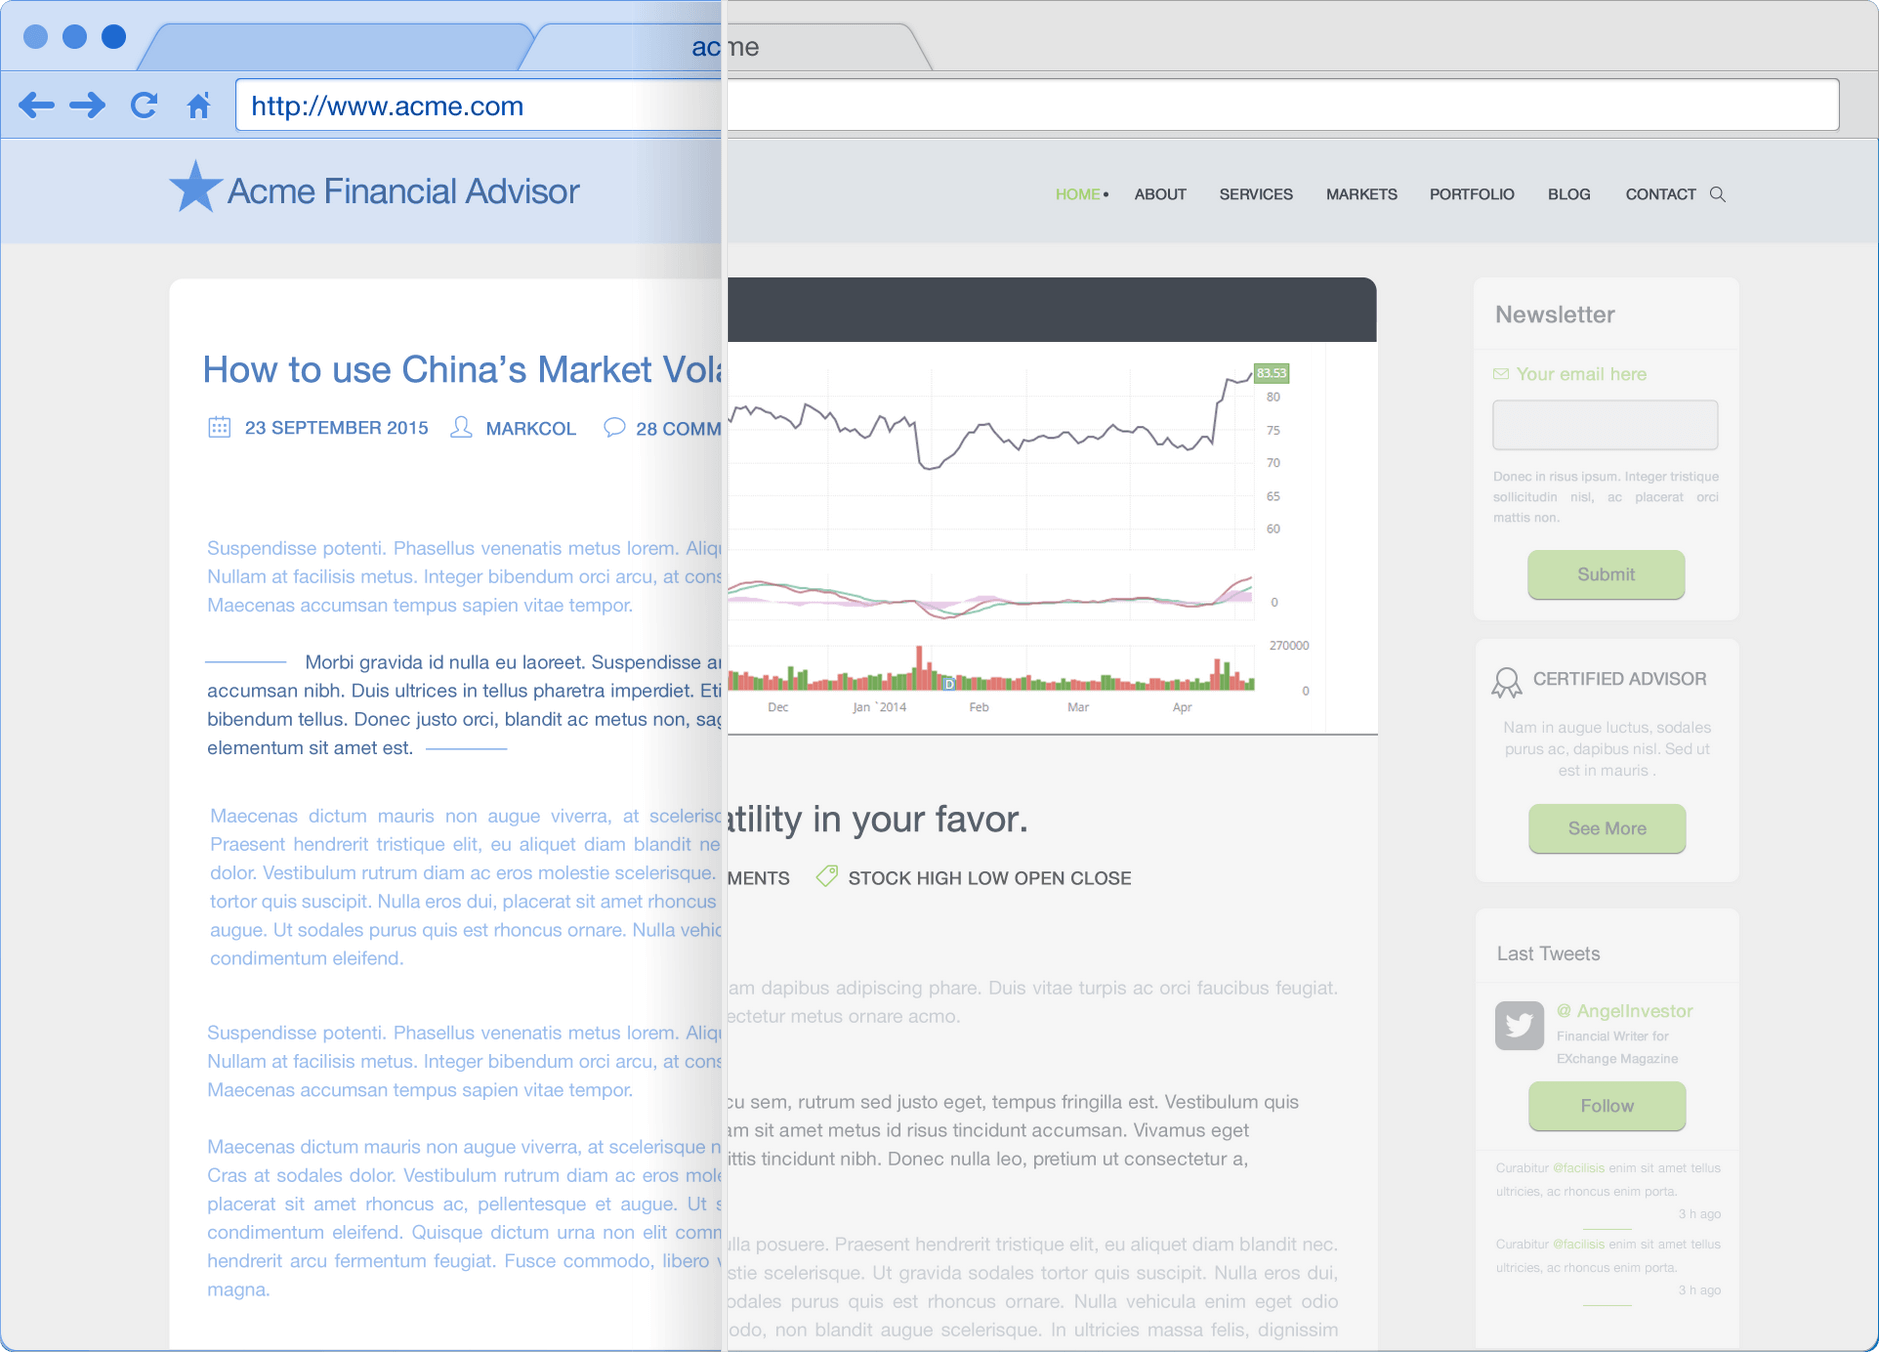
Stockdio conforms to modern HTML5 standards letting you deploy fully responsive charts and stock market data visualizations on your site, financial portal or mobile applications without writing a single line of code via an 'iframe'.

For developers by developers

Stockdio endpoints are exposed as REST APIs that can be integrated into your application, using your framework and language of choice, such as Javascript, .Net, PHP, Ruby and Node.js, among many others!

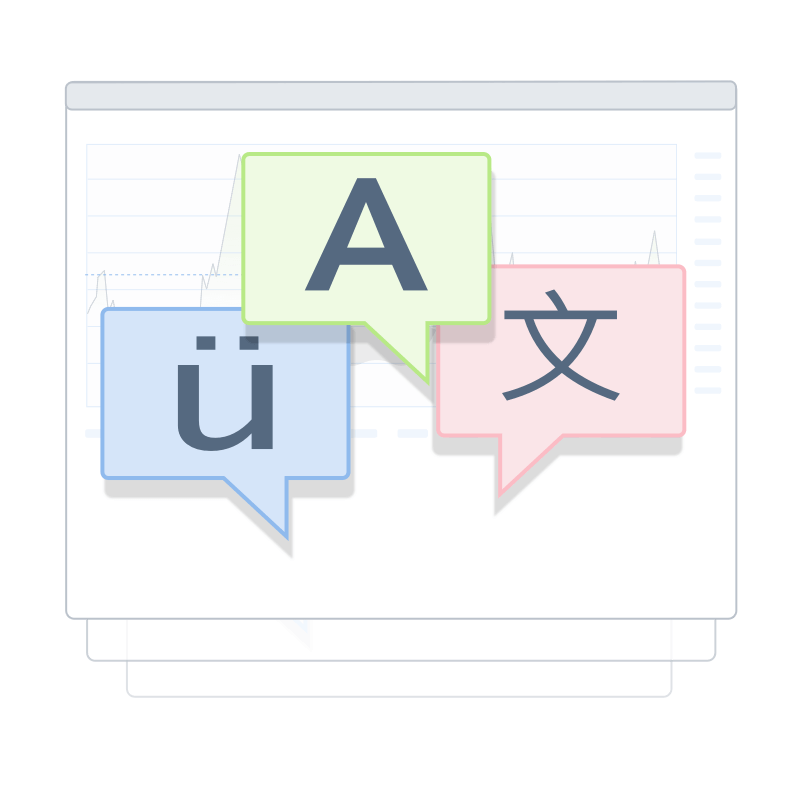
Localization with 'Cultures' NEW

Changing languages is as easy as point and click! With over 20 different Cultures and more being added you can show your stock exchange data in your own language so your audience feels right at home.
View all cultures available

Do you need a custom solution?

We can help! Stockdio was built with Chart FX, our powerful charting engine, that has led the business intelligence for developers for more than 25 years. Our team is here to assist you so contact us today!

Explore how Stockdio can help you present bigger data and faster visualizations across changing scenarios.

Meet Jim. He's a Web Developer
for Investor Relations Site of a Publicly Traded Company.

Before Stockdio he was overwhelmed mastering dozens of libraries and documentation in order to present even the simplest charts on the corporate website, so ended up writing plain text.

Jim was looking all over the web to find plugins that allow him to present some basic charts, on his best day it would take him at least an hour to test, debug and get the libraries running before bringing the new data in.

Most of his financial front-end ended up as plain text content with a lot of jibber-jabber talk trying to explain financial data and trends without any visual aids for the readers.

Now he provides site partners and visitors with professional charts and easy to read graphs instead of plain text.

Easy to use

We've spent an amazing amount of hours making it extremely easy to use for you. Just point and click to create your dream graphs in seconds.

Faster publishing

Generate as many charts as you like and paste them all over your sites or apps for faster distribution and updates. We take care of the rest!

Readable complex data

We've got you covered with all types of Financial Data and Indicators. Never mind struggling with dozens of libraries to present readable data.

End user satisfaction

While helping you succeed with our amazing products we also help you engage and build a happier and more loyal audience for your business.

Ready to start presenting your own charts in minutes?

Gracie is a Financial Consultant, Professional Blogger & Writer.

Before Stockdio she was serving content by clipping and stitching from external sources and mocking up her own graphs in Excel.

Gracie used to pull financial data and trends from several sources to accommodate it into her data sheets to later convert that into some cheesy graphics from Excel.

Despite her knowledgable advise in financial matters her blog and reports were looking dull and hard to read and her projects were losing that cutting edge feeling she was known for.

Now she serves more meaningful content and her readers are always coming back for more. With enhanced visualizations her blog easily stands out from the rest.

Copy, paste and publish

We take pride on this! Create a new graph in seconds, copy the code and paste it inside your projects to amaze your stakeholders.

Meaningful data content

Enable an entire new communication channel for your readers with pixel-perfect dynamic visuals to backup your prose.

Visitors are coming back

The old days of boring financial posts and publications are over! Your audience is coming back for more knowing you're up to date with the latest financial technology trends and data.

Become the authority!

There's no tool like Stockdio to serve single graphs, entire dashboards or apps. We give you an edge to stay ahead your competition and stand out as the authority.

Ready to start posting beautiful data charts in minutes?

Take Donald's case. He works for a
Stock Trading Company

Before Stockdio he was asked to revamp the User Experience at the company's front-end, but he was having trouble adding true value on top of the services they already offer to their clients.

In our rapidly changing world running out of added value at the highest level of the game is an expensive mistake no company can afford. Donald knew it is critical to draw value from external technology experts.

He discovered Stockdio and immediately fell in love with it, and so did his stock trading clients when they noticed how fast and sharp the data was being presented and delivered to them.

Check out Bill. He's a Project Manager for a
Software Development Company

Before Stockdio Bill had to hire third-party developers to expand his team in order to meet the tight deadlines their financial customers require on web and app development.

Keeping up with the frenetic pace of production nowadays is no easy task. From small agencies to large development firms the need of delivering better, faster, more competitive and optimized apps and data seems to be the common factor.

Bill had decided that the best option was to team up with third-party development agencies and even hired a financial advisor to help him define the scope and understand the lingo of their top financial clients. But all this was costly and time consuming.

Now he and his team rely on the flexibility, power and non-technical approach of Stockdio to deliver charts and graphs inside their financial apps in minutes and without having to pay for third-party development.

Low-cost for high-end dashboards

What used to take weeks and thousands of dollars now takes minutes at a predictable scalable price. The powerful zero coding, non-technical approach of Stockdio Services makes it a breeze to generate dozens of charts and layout an entire dashboard in no time!

More apps delivered in less time

Create your apps in any programming language you like and embed your charts on any part of them. Or create full financial apps and dashboards in minutes by simply copying and pasting the chart's code. Deploy and keep your apps easily updated from the cloud.

Full data configuration and control

Stockdio Services comes pre-integrated with all the financial data of public trading companies in a number of different market exchanges. You can point and click to fully configure which Markets, Data Types, Symbols, Indicators, Parameters, Dates and Ranges, among others, are enabled for visualization and comparison inside your charts.

Extensive motifs and palette galleries

Stockdio not only offers you full control of the look and feel of your Financial Data but also offers you a quick and easy way to enable entire Motifs and Color Palettes that can turn a boring chart into a shining start in one click and help you stay consistent across projects!

Ready to stop coding and start creating charts for your apps?

There's Mark. Senior Web Developer for a
Financial News Site

Before Stockdio Mark and his team were dealing with 2 mayor issues when presenting graphical data: recurrent high spikes on server loads and low customization options to match their branding.

When you run your apps on a poorly optimized code or server it can increase your operational costs and impact your business even with a small audience. That impact can grow exponentially up to an unsustainable point when you are publishing for a larger audience.

Arbitrary templates and little customization options to match your brand could significantly damage your corporate image and confuse your audience, not to mention that they look amateurish and unprofessional. Also, paying extra to enable these features often raises concerns and discontent.

Now Mark has significantly reduced the server load rendering graphical data directly from the Stockdio CDN and gained full customization control with motifs, palettes and advanced options at no extra cost.

Blasting fast CDN

Lightning Speed loading times for any number of dynamic charts from our Content Delivery Network, even with animations enabled.

Zero server load

Your current infrastructure and bandwidth will not be impacted. All data and graphs are loaded fast from our CDNs.

Match your brand

Not only you will be able to match your brand and corporate image with motifs, custom colors and fonts, the charts help your brand appear stronger and up to the market trends.

Fully customizable appearance

Stockdio offers you full customization of your chart's size, colors, borders, logo and more through the 'Advanced Options', all in the same User-Friendly Interface.

Ready to start creating beautiful light-speed charts for your apps?

Have you met Jeff? He's a Data Analyst
for a fortune 500 company

Before Stockdio Jeff was always looking for new ways to bind and compare data. He had developed some very pragmatic methods to generate the intelligence that put him ahead the competition but couldn't find the technical edge to turn those into agile processes.

Looking for a practical way to overlay and compare financial data out there could be a time consuming and frustrating task. Most data visualization options are designed without a specific vertical in mind and the learning curve could turn into a trap between documentation, solution integrations and customisations.

Going agile means being able to publish faster and when you release quickly, you have an advantage over your competitors. If you add your Data Analysis Expertise on top of Stockdio which is already agile you get twice the traction and focus for your business with little technical effort and zero frustration on your end.

Now Jeff is able to mix, match, compare and generate smart new data with just a few clicks and present the results to his Fortune 500 Clients in minutes while skipping all technical aspects of it.

Keep it in the Cloud

No installations, backups or infrastructure requirements. You get the best of the Business Intelligence world with the best of Cloud Infrastructure already in place.

In-depth filtering

Integrated with every data type, indicator and parameter you can think of to filter and visualize data from any public trading company in US and India* Markets.
(*=Additional fees apply)

Overlay Combined Data

Mix. match, compare and present data from multiple stock markets and companies and create your custom graphs and charts from more than 2500 pre-integrated sources.

Friendly and Cutting Edge

Leverage the non-technical user-friendly approach that Stockdio has taken to give you an advantage over your competitors and turn your processes into a full agile strategy today.

Ready to optimize your workflow and dazzle your partners?